Reporting and exporting
- Adam Evans
- Roly Birkwood
- Agatha Morgan (Unlicensed)

This guide will demonstrate how to filter through your system's database to display a list of case as search results. It will then describe how to choose which information is displayed against your cases. We then look at how to generate some statistics from your results, and finally we discuss how to export the view of your results to excel.
Contents
Filtering your results
Your eKeeper system can contain a potentially vast database of Cases and Products, and also Applicants/Clients assigned to those Cases or Products. The eKeeper reporting tool enables you to filter down your database and display a list of cases that meet a particular set of criteria that you provide. This section will show you how to filter your database down by your desired criteria; for example, you may wish to display cases that have completed in the month of May, or find cases that enquired in January.
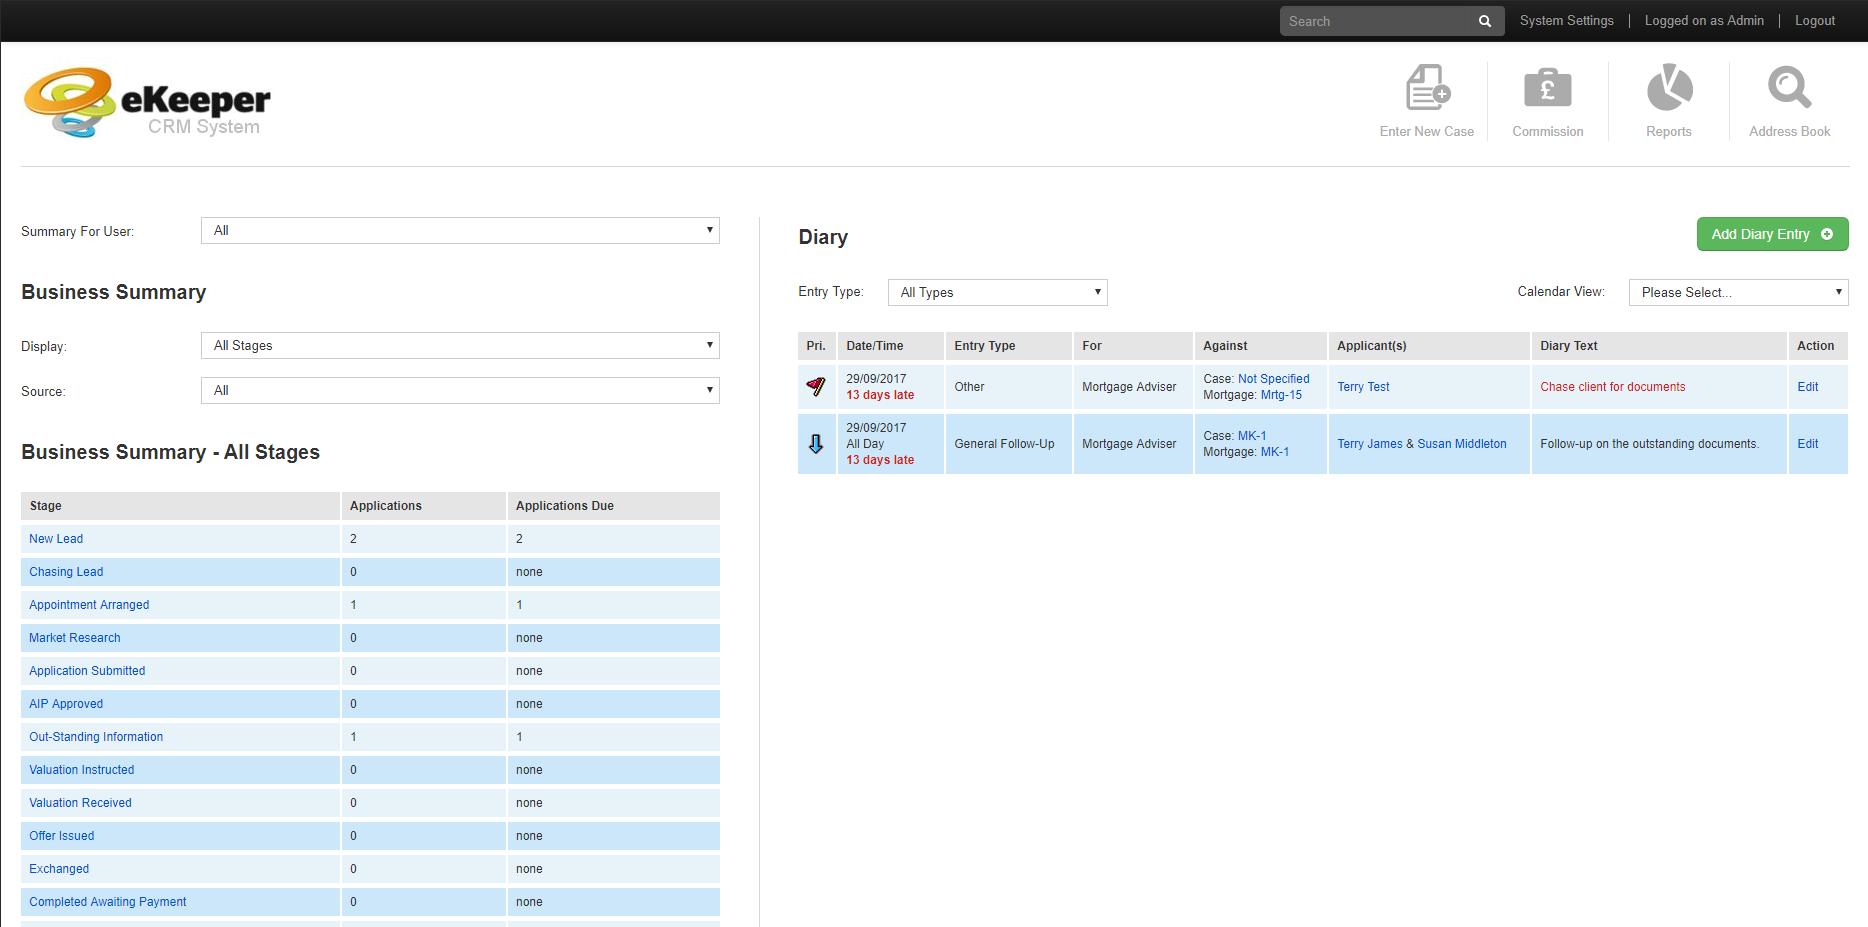
To begin navigate to your Homepage (see right) and look for the Reports button in the top right corner of the page (figure 1)

Figure 1 - Reports Button
Selecting search area
You will now see the Search Criteria selection page. To continue select the area you wish to search using the appropriate button at the top of right of the page (figure 2)

Figure 2 - Search Area buttons
You have the opportunity to search by the following areas
- Cases - Cases house your customer's products
- Customers (clients) - these are the individuals
- Products - A button will apear for each product type in your system i.e. Mortgages, Protection etc.
Selecting your Search Criteria
Now that you have chosen your area, you will see a number of search criteria on the page in front of you. Below is an example of a search against 'Mortgages'. To continue simply select your desired criteria.
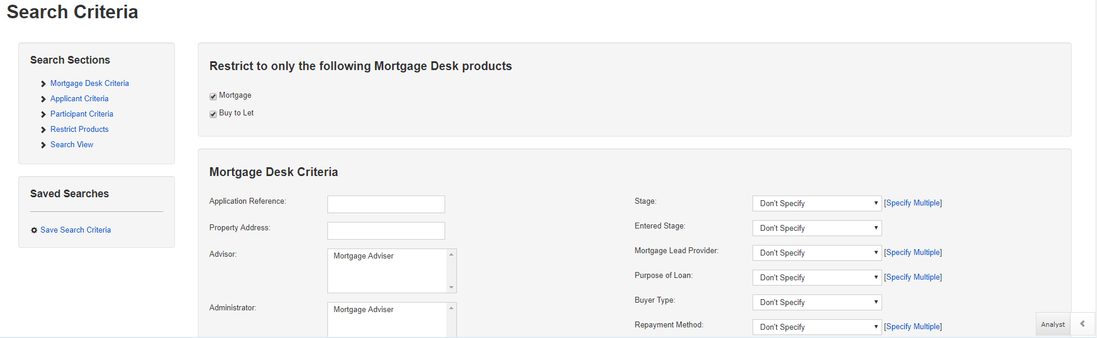
Figure 3 - Search Criteria (Mortgage Desk Search)
Note
If you have already performed a search since you logged in, you may some criteria has been remembered from your last search. Click the clear search button on the bottom navigation bar to renew your search
![]()
Selecting the information to be displayed
So far you have selected the criteria that filters your database down and restricts the results that are displayed when you click search. However the information that displays against your cases/products is key to the report that is produced. To determine the information displayed you need to select a search view, this will decide on the information that is displayed against your results
To select a search view, scroll to the bottom of the page and find a section titled How would you like to display the results? (figure 4). This will list the current search views available in your system.

Figure 4 - Search View selection section (search criteria page)
What is a search view?
When performing a search, your results will normally be grouped by case or product. A search view determines which information from those cases/products are displayed.
Tip
If you would like to learn how to create new custom search views please read our Creating New Search views article.
Confirming your search
To confirm your search click the Search button that appears in the bottom navigation bar (figure 4).
![]()
Figure 4 - Bottom Navigation Bar
You will now see your search results.
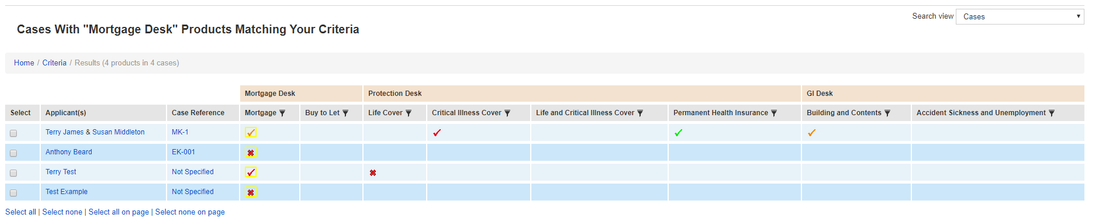
Figure 5 - Search Results (for a mortgage desk search)
Changing the search view in your results
Now that you have your search results, you may decide you want to change the data you wish to be display against your results. To do this use the Search View dropdown field to the top right of your results (figure 6). Simple select the view you wish to change your results to and the results will dynamically update.
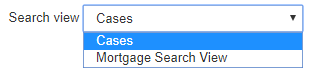
Figure 6 - Search Views
Grouping your search results to generate some statistics
eKeeper provides the option to generate some statistics based on the results of your search.
To group your results click the Group Results button on the bottom navigation bar.
![]()
Figure 7 - Navigation Bar (bottom)
A box will then appear that allows you to breakdown your results and provide some statistics.
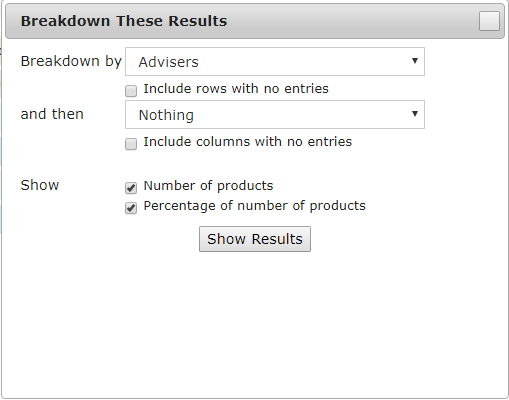
Figure 8 - Breakdown These Results window
Once you have decided on your breakdown options (see right), click the show results button. You should then see something similar to the screen below.
The example below is a breakdown by the Adviser and then lender, showing number of products and percentage of number of products.
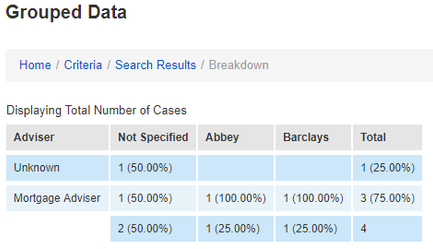
Figure 9 - Grouped Data Breakdown
Note
The option to Export to Spreadsheet is not currently available on the Cases search view
Tip
You can export this view to a spreadsheet by clicking the export to spreadsheet button which is located in the buttom navigation bar.
![]()
Exporting your search results
Once you have your results and you have settled on a search view, you can then export your results to an excel spreadsheet.
To do this you need to select the results you wish to export (figure 10)
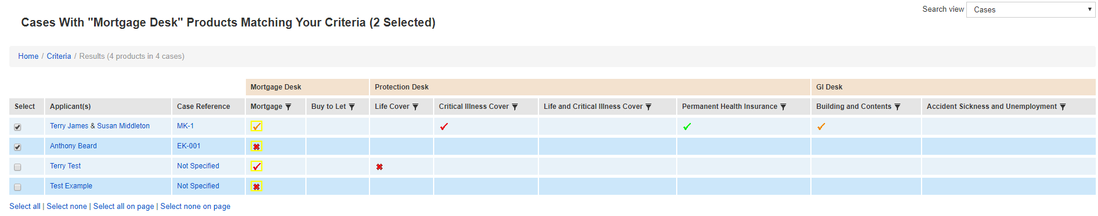
Figure 10 - Search Results (2 results selected)
All you need to do next is click the Export To Spreadsheet button on the bottom navigation bar (figure 11)
![]()
Figure 11 - Navigation bar (bottom)
Contents
In this article we have covered:
Articles in this series